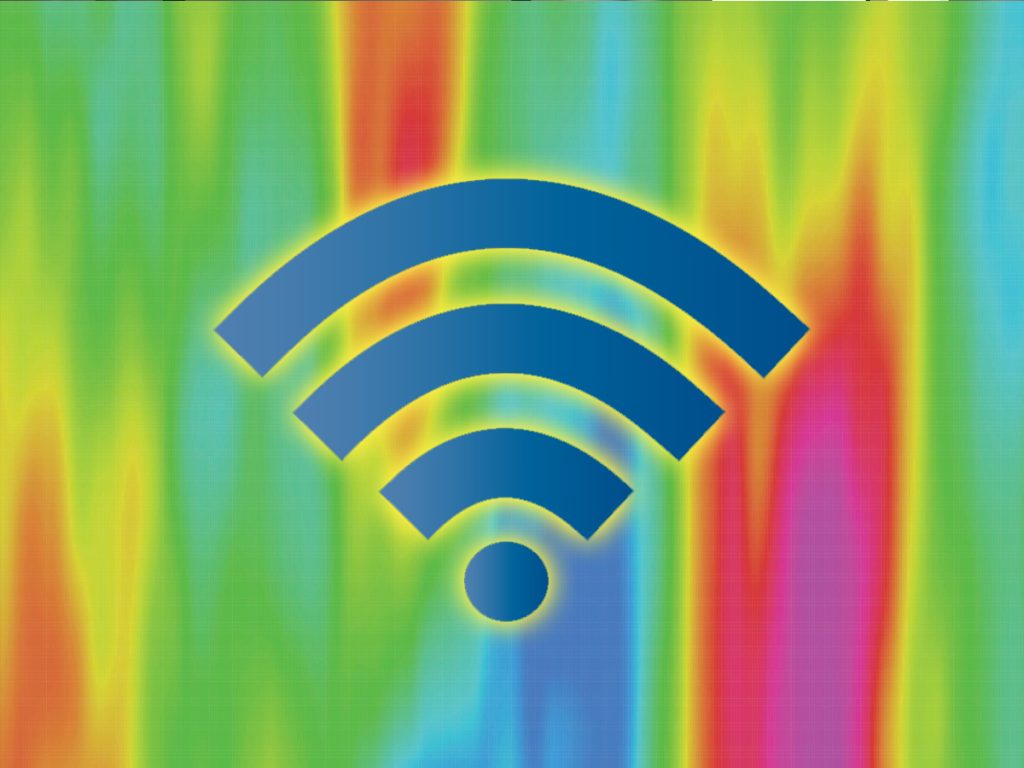
What Are Wireless Network Heat Maps?
WiFi heat maps are visual representations of wireless signal strengths in given areas. They are tools that analyze and optimize wireless networks’ coverage and performance – particularly in large indoor spaces such as offices, warehouses, and hospitals.
Heat maps show the strength of the WiFi signals at different locations by using different colors or shades. Usually, warmer colors like red, orange, and yellow indicate strong signals, while cooler colors like blue and green indicate weaker signals.
These heat maps help network administrators identify areas with poor coverage or high interference and indicate ways to optimize networks’ performances. For example, solutions may involve adjusting the placement of access points, changing the antenna direction, or adjusting transmission power levels.

Horizon Electronics
7925 Evies Way
Port Richey, FL 34668
727-845-4444


